Land Vista
A data-driven decision-support platform built for Telangana's real estate market, where fluctuating land prices and a lack of comprehensive analysis tools make it hard for investors and homebuyers to identify profitable areas with confidence.
Land Vista lets users select a region, view historical price trends, and get AI-generated future price predictions alongside personalized business investment suggestions tailored to that area.
Overview
Land Vista was built as a team project (Unity Minds, GNITC) to address a gap in Telangana's real estate market: investors, homebuyers, and business owners had no single tool combining historical price trends, predictive modeling, and location-specific investment guidance.
The platform lets a user pick a region: Central, North, South, East, or West Hyderabad and see both historical land price data and AI-projected future prices, alongside recommendations for what type of business is likely to succeed there based on local trends and demographics.
Problem It Solves
- No comprehensive tool existed to guide real estate decision-making in Telangana's market.
- Fluctuating land prices made it difficult to identify which areas were actually profitable.
- Investors lacked personalized, data-backed business investment suggestions for a given location.
Key Features
Price Prediction by Region
- Users select a specific region (Central, North, South, East, West) to view historical pricing data.
- AI models project future land prices based on that historical trend.
Business Suggestions
- Recommends profitable business types for a selected area based on past trends and existing local businesses.
- Example: West Hyderabad (Kondapur) — existing businesses include food stalls, shopping malls, and PG hostels; the system suggested co-working spaces and cafés given the area's growing population.
Personalized Investment Advice
- Tailors investment suggestions to projected returns and individual user preferences.
- Aims to maximize profit potential while reducing guesswork in site selection.
Interactive Dashboard
- Real-time data visualization with graphs and charts for price trends.
- Side-by-side investment comparison across regions.
Prediction Factors
- Historical price trends and seasonality
- Economic indicator analysis
- Comparative market analysis
- Location and proximity factors
- Real estate development trends
Target Audience
- Real estate investors and brokerages
- Small investors and homebuyers
- Business owners and corporations scouting locations
- Government and urban planning bodies
System Architecture
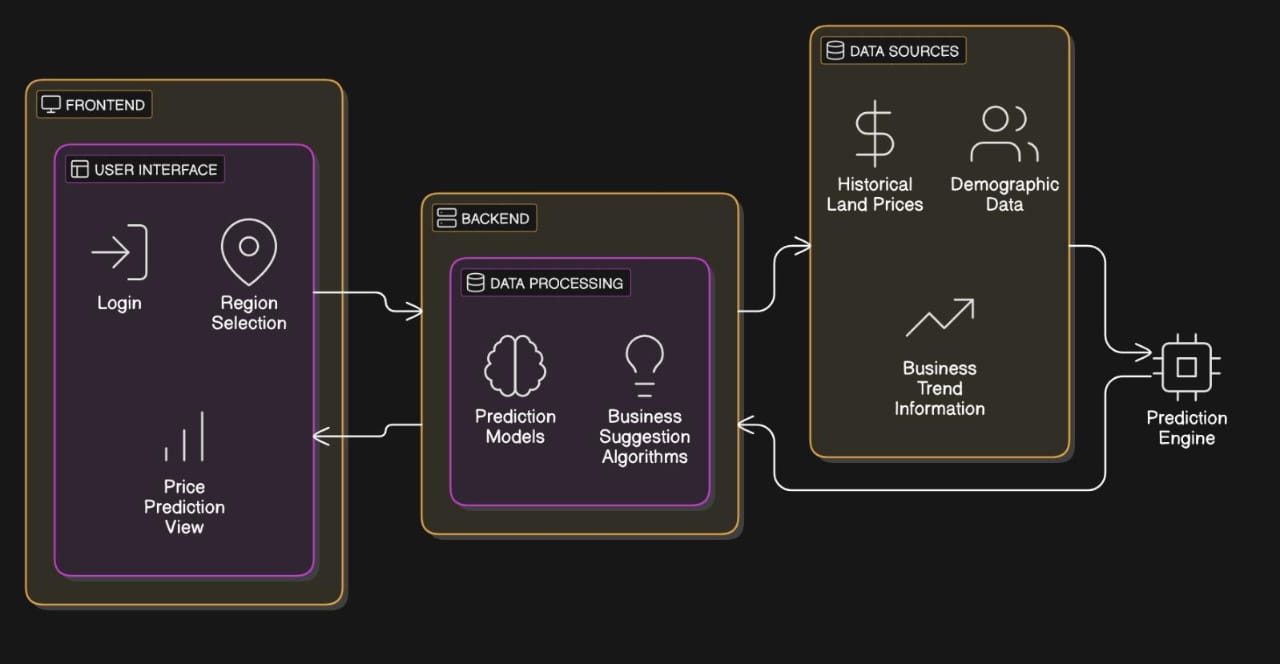
User Flow
- User logs in and enters a location.
- Region Analysis path → Price Prediction (graphs/charts) → user selects a year for analysis.
- Business Prediction path → Business Trends and Business Suggestions for that region.
System Requirements
- Backend: Python (Django or Flask), Pandas for data handling, Scikit-learn for the ML models.
- Frontend: HTML, CSS, JavaScript, Chart.js for data visualization.
- Database: SQLite or MySQL for user data and storage.
Results
Benchmarked against traditional (non-AI) real estate prediction methods, the AI-powered platform showed a meaningful lift across key metrics: roughly 25% higher ROI, 15% growth in investor engagement, and about 50% risk reduction compared to traditional approaches.